Review of Production Activity
Organization of Technological Connections
Results of activity on technological connection in 20101
| Indicator | Unit | 2009
| 2010
| Deviation 2010 / 2009 | |
|---|---|---|---|---|---|
| Abs | rel | ||||
| Leningrad Region | |||||
| Revenue | RUR thousand | 1 712 144 | 2 256 775 | 544 631 | 31,8% |
| Connected capacity | MW | 142,4 | 185,3 | 42,9 | 30,2% |
| Average rate under closed contracts | RUR thousand/MW | 12 028 | 12 180 | 152 | 1,3% |
| St. Petersburg | |||||
| Revenue | RUR thousand | 4 613 870 | 7 906 919 | 3 293 049 | 71,4% |
| Connected capacity | MW | 210,6 | 460,0 | 249,4 | 118,4% |
| Average rate under closed contracts | RUR thousand/MW | 21 909 | 17 190 | -4 719 | -21,5% |
| JSC "Lenenergo" total | |||||
| Revenue | RUR thousand | 6 326 014 | 10 163 694 | 3 837 680 | 60,7% |
| Connected capacity | MW | 352,9 | 645,3 | 292,3 | 82,8% |
| Average rate under closed contracts | RUR thousand/MW | 17 924 | 15 751 | -2 173 | -12,1% |
1 without connection of generating capacities
The increase in revenue on technological connection in 2010 relative to 2009 was generally associated with the growth of volumes in obligations fulfillment towards applicants.
Lost incomes of JSC of Lenenergo in 2010-2011
| Branch | 2010
| Grounds | 2011 | Grounds | In total |
|---|---|---|---|---|---|
| St. Petersburg | The Order No.249-r as of 28.12.2009 "On establishment of payment for technological connection to electric networks of JSC "Lenenergo" in the territory of St. Petersburg for 2010" | The Order No.384-r as of 29.12.2010 "On establishment of payment for technological connection to electric networks of JSC "Lenenergo" in the territory of St. Petersburg for 2011" | |||
| Leningrad Region | The Order No.З as of June 30, 2010 No.69-p "On approval of the size of economically reasonable payment and corresponding lost incomes of JSC "Lenenergo" from connection of power accepting devices by the maximum capacity which is not exceeding 15 kW inclusively, which size is included into the tariff for electric power transmission services in 2010" (in edit. of the Order of the Committee on tariffs and price policy of Leningrad region as of 24.09.2010 No.124-p) | 0,00 | - | ||
| JSC "Lenenergo" | 848 280,00 | 47 318,00 | 895 598,00 |
Lost incomes of JSC "Lenenergo" for 2010-2011 were established by legislative and regulatory base over St. Petersburg and the Leningrad Region.
The Order No.22-p as of 25.02.2011 "On approval of payment rates for technological connection to electric networks of JSC "Lenenergo" of power accepting devices located in the territory of the Leningrad Region" did not establish lost incomes in the Leningrad Region for 2011.
Dynamics of demand for technological connection of power accepting devices
For 12 months 2010 the volume of capacity declared by consumers on JSC "Lenenergo" amounted to 14,686 pcs with capacity of 2,089.7 MW. The basic share of requests was accepted from applicants across the Leningrad Region and amounted to 11,162 pcs with a total capacity of 1,011.6 MW. In general, on JSC "Lenenergo" the group of applicants up to 15 KW constituted 85% from total applications at a 6% share in the total installed capacity. Following the results of 2010, there was indicated growth in the quantity of applications accepted by JSC "Lenenergo" concerning the similar period of 2009 by 22%.
Volume of the declared capacity
| JSC "Lenenergo" | Installed capacity | |||
|---|---|---|---|---|
| 2009 | 2010 | |||
| Applications accepted, pcs. | Total capacity, MW | Applications accepted, pcs. | Total capacity, MW | |
| Total, including | 11444 | 1 883 600 | 14686 | 2 089 700 |
| St. Petersburg | 2809 | 1 255 500 | 3524 | 1 078 132 |
| Leningrad Region | 8635 | 628 100 | 11162 | 1 011 571 |
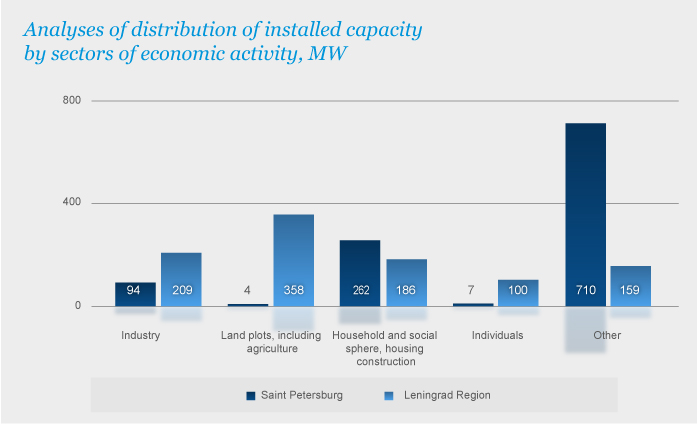
The analysis of distribution over economic activities for 2010 showed that the household and social sphere, as well as housing construction took first place in installed capacity, and constituted 24% from the total installed capacity across St. Petersburg and 18% from the total installed capacity across the Leningrad Region.
Distribution of installed capacity by sectors of economic activity (MW)
| Economic activity | St. Petersburg | Leningrad region | Total |
|---|---|---|---|
| Industry | 94 | 209 | 303 |
| Land plots, including agriculture | 4 | 358 | 362 |
| Household and social sphere, housing construction | 262 | 186 | 448 |
| Individuals | 7 | 100 | 107 |
| Other | 710 | 159 | 869 |

| Connection category | Contracts concluded | Contracts executed | ||
|---|---|---|---|---|
| Pcs. | Capacity, MW | Pcs. | Capacity, MW | |
| JSC "Lenenergo" | ||||
| up to 15 kW | 10164 | 102,33 | 3269 | 25,99 |
| from 15 up to 100 kW | 559 | 25,44 | 411 | 17,89 |
| from 100 up to 750 kW | 357 | 111,89 | 350 | 114,71 |
| over 750 kW | 79 | 389,80 | 143 | 486,69 |
| TOTAL | 11159 | 629,46 | 4173 | 645,28 |
| St. Petersburg | ||||
| up to 15 kW | 887 | 6,30 | 742 | 3,91 |
| from 15 up to 100 kW | 313 | 13,27 | 269 | 11,43 |
| from 100 up to 750 kW | 140 | 44,09 | 231 | 81,93 |
| over 750 kW | 50 | 184,21 | 114 | 362,72 |
| TOTAL | 1390 | 247,87 | 1356 | 459,99 |
| Leningrad Region | ||||
| up to 15 kW | 9277 | 96,03 | 2527 | 22,08 |
| from 15 up to 100 kW | 246 | 12,18 | 142 | 6,46 |
| from 100 up to 750 kW | 217 | 67,80 | 119 | 32,78 |
| over 750 kW | 29 | 205,58 | 29 | 123,98 |
| TOTAL | 9769 | 381,59 | 2817 | 185,29 |
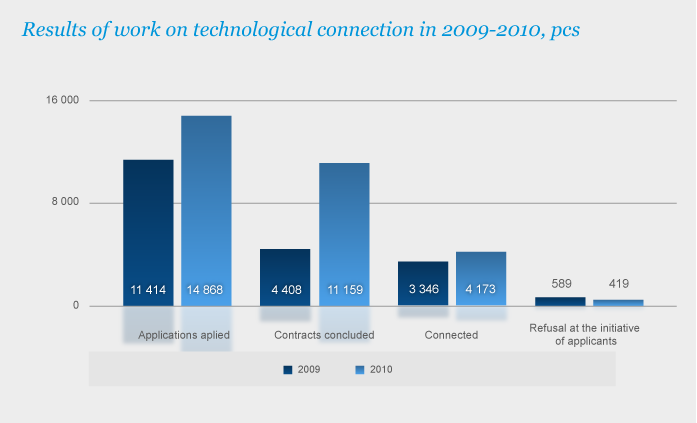
Following the results of 2010, the Company concluded 11,159 contracts for a total capacity of 629.5 MVA and a cost of RUR 7,798.6 mln (net of VAT) that exceeded the indicators of the similar period of 2009 of quantity – in 2.5 times, of capacity – by 15.9 МVА (2.5%), of cost – by RUR 1,111 mln (net of VAT) (14.2%). The share of the contracts concluded across St. Petersburg, in the total amount for 12 months 2010, constituted 1,390 pcs for capacity of 247.9 МVА, and a cost of RUR 5,665.7 mln (net of VAT). Across the Leningrad Region for 2010 there were concluded 9,769 contracts for a capacity of 381.6 МVА and a cost of RUR 2,132.9 mln (net of VAT).
The quantity of the performed obligations for 2010 amounted to 4,173 contracts for the capacity of 645.3 МVА and the cost of RUR 10,163.7 mln (net of VAT). In comparison with the similar period of 2009 (3,346 pcs, 352.9 МVА, RUR 6,326.0 mln (net of VAT) there was observed quantity growth by 19.8%, capacity growth by 1.8 times, and cost growth of RUR 3,837.7 mln (net of VAT) by 1.6 times.

For the reporting period there was indicated a decrease in the share of refusals at the initiative of applicants concerning 2009, including on small and medium-sized business (capacity up to 750 kW) by 54%, on large business (capacity over 750 kW) - by 50%.
For 2010, nine contracts for a total capacity of 108 kW were terminated.
Top

