


Review of Production Activity
Key Operating Performance Indicators
Key operational performance indicators on electric power supply to the network, the volume of services on electricity transmission and electric power losses in JSC "Lenenergo" networks for 2008-2010 are presented in the table:
| Indicators | Supply to network, mln kWh | Volume of rendered services in electricity transmission, mln kWh | Total losses | |||||||||
|---|---|---|---|---|---|---|---|---|---|---|---|---|
| 2008 | 2009 | 2010 | 2008 | 2009 | 2010 | Mln kWh | % | Mln kWh | % | Mln kWh | % | |
| 2008 | 2009 | 2010 | ||||||||||
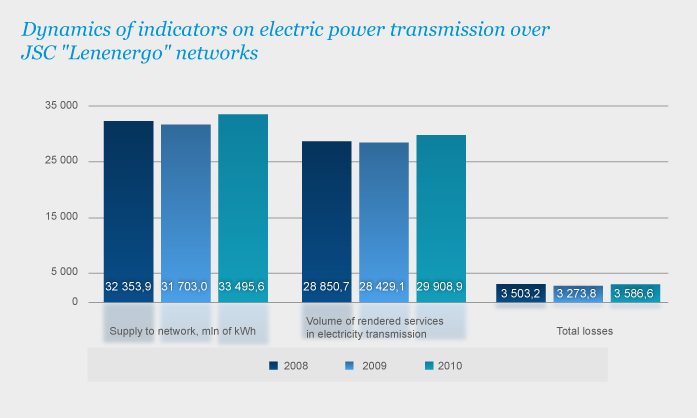
| JSC "Lenenergo", Including: | 32353,9 | 31703,0 | 33495,6 | 28850,7 | 28429,1 | 29908,9 | 3503,2 | 10,8 | 3273,8 | 10,3 | 3586,6 | 10,7 |
| St. Petersburg | 20311,7 | 20222,4 | 21244,0 | 18212,8 | 18036,7 | 18930,8 | 2098,9 | 10,3 | 2185,7 | 10,8 | 2313,3 | 10,9 |
| Leningrad region | 12042,2 | 11480,6 | 12251,5 | 10637,8 | 10392,4 | 10978,2 | 1404,3 | 11,7 | 1088,2 | 9,5 | 1273,3 | 10,4 |
Dynamics of indicators on electric power transmission over JSC "Lenenergo" networks
Dynamics of the volume of services for electric power transmission in 2008-2010
| Volume of services in electric power transmission, mln kWh | |||||||
|---|---|---|---|---|---|---|---|
| 2008 | 2009 | 2010 | 2010 / 2008 | 2010 / 2009 | |||
| Mln kWh | % | Mln kWh | % | ||||
| JSC "Lenenergo", Including: | 28 850,7 | 28 429,1 | 29 908,9 | 1 058,3 | 3,7 | 1 479,8 | 5,2 |
| St. Petersburg | 18 212,8 | 18 036,7 | 18 930,8 | 717,9 | 3,9 | 894,1 | 5,0 |
| Leningrad Region | 10 637,8 | 10 392,4 | 10 978,2 | 340,4 | 3,2 | 585,8 | 5,6 |
Following the results of JSC "Lenenergo" in 2010, the volume of services in electric power transmission amounted to 29,908.9 mln kWh, which exceeds the indicators:
- of 2008 (28,850.7 mln kWh) by 1,058.3 mln kWh, or by 3.7%;
- of 2009 (28,429.1 mln kWh) by 1,479.8 mln kWh, or by 5.2%.
Revenue from services in electric power transmission for 2010
| Approved business plan | Fact | |||||
|---|---|---|---|---|---|---|
| Productive supply, mln kWh | Revenue including VAT, RUR mln | Average tariff, net of VAT, RUR/kWh | Productive supply, mln kWh | Revenue including VAT, RUR mln | Average tariff, net of VAT, RUR/kWh | |
| JSC "Lenenergo", including: | 28 972,92 | 26 548,74 | 0,78 | 29 094,70 | 28 170,03 | 0,83 |
| St. Petersburg | 18 549,36 | 16 013,49 | 0,73 | 18 625,89 | 17 665,70 | 0,81 |
| Leningrad Region | 10 423,56 | 10535,24 | 0,87 | 10 468,81 | 10 504,32 | 0,87 |