Financial Results Overview
Financial Performance
Balance sheet
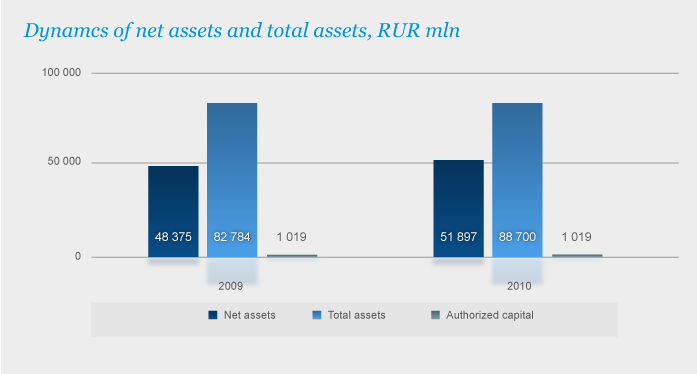
Balance currency (i.e. the sum of assets at the Company’s disposal) at the end of 2010 constituted RUR 88,700 mln. In comparison with the balance sheet as of 31.12.2009, the total sum of property of the Company and sources of its forming increased by RUR 5,916 mln (7.1%). The principal causes of changes in the balance sheet are as follows:
- Accomplishment of the investment program of the Company;
- Reception of JSC "Lenenergo" following the results of 2010 of net profit.
As JSC "Lenenergo" is an enterprise related to capital-intensive industry, the structure of liabilities of the balance sheet of the Company is characterized by a great volume of borrowed funds, and non-current assets prevail in the asset structure.
As of 31.12.2010, the balance sheet of the Company is characterized by the following peculiarities:
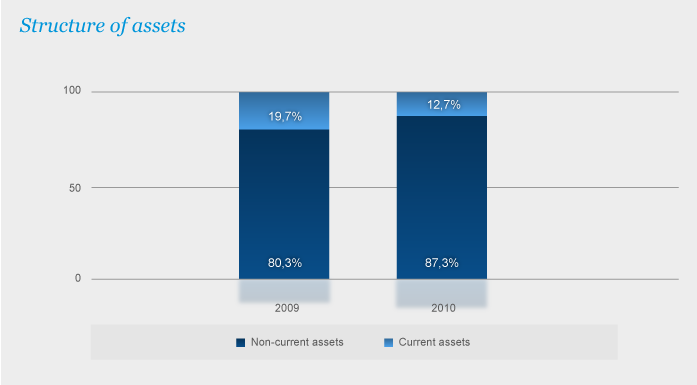
- High share of non-current assets – 87.3% of balance currency;
- High share of accounts receivable – 10.8% of balance currency, or 85.0% of current assets;
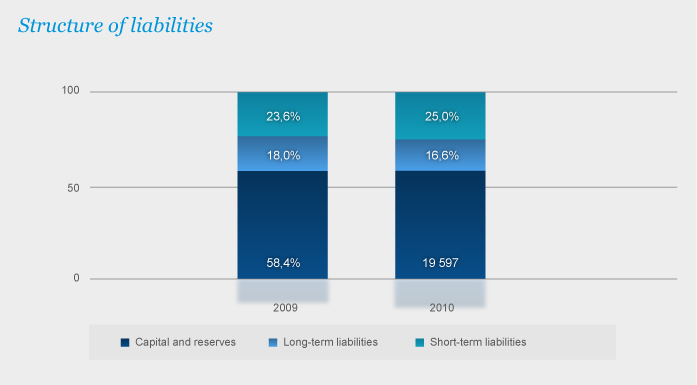
- Considerable volume of loans and credits – 16.6% of balance currency, 39.9% of total liabilities of the Company.
RUR mln
| Line | Line code | 31.12.2009 Fact | Share in balance currency (BC), % | 31.12.2010 Fact | Share in balance currency (BC), % | Changes relative to 31.12.09 (+,-) | ||
|---|---|---|---|---|---|---|---|---|
| Sum | % | By share in BC | ||||||
| (1) | (2) | (3) | (4) | (5) | (6) | (7)=(5)-(3) | (8)=(7)/(3) | (9)=(6)-(4) |
| ASSETS | ||||||||
| Non-current assets | ||||||||
| Intangible assets | 110 | 105 | 0,1% | 145 | 0,2% | 40 | 37,9% | 0,0% |
| Fixed assets | 120 | 53 116 | 64,2% | 61 616 | 69,5% | 8 499 | 16,0% | 5,3% |
| Construction in progress | 130 | 12 483 | 15,1% | 14 484 | 16,3% | 2 001 | 16,0% | 1,3% |
| Long-term financial investments | 140 | 579 | 0,7% | 946 | 1,1% | 367 | 63,5% | 0,4% |
| Deferred tax assets | 145 | 163 | 0,2% | 206 | 0,2% | 43 | 26,3% | 0,0% |
| Total for Section I | 190 | 66 447 | 80,3% | 77 398 | 87,3% | 10 951 | 16,5% | 7,0% |
| Current assets | ||||||||
| Inventories | 210 | 1 408 | 1,7% | 1 108 | 1,2% | -300 | -21,3% | -0,5% |
| Value-added tax | 220 | 284 | 0,3% | 256 | 0,3% | -27 | -9,6% | -0,1% |
| Accounts receivable (over 12 months) | 230 | 1 270 | 1,5% | 1 098 | 1,2% | -172 | -13,5% | -0,3% |
| Accounts receivable (less than 12 months) | 240 | 10 794 | 13,0% | 8 512 | 9,6% | -2 282 | -21,1% | -3,4% |
| Short-term financial investments | 250 | 100 | 0,1% | 0 | 0,0% | -100 | -100,0% | -0,1% |
| Monetary funds | 260 | 2 483 | 3,0% | 329 | 0,4% | -2 154 | -86,8% | -2,6% |
| Total for Section II | 290 | 16 337 | 19,7% | 11 303 | 12,7% | -5 034 | -30,8% | -7,0% |
| Balance (sum of lines 190+290) | 300 | 82 784 | 100,0% | 88 700 | 100,0% | 5 916 | 7,1% | 0,0% |
| LIABILITIES | ||||||||
| Capital and Reserves | ||||||||
| Authorized capital | 410 | 1 019 | 1,2% | 1 019 | 1,1% | 0 | 0,0% | -0,1% |
| Additional capital | 420 | 40 897 | 49,4% | 40 469 | 45,6% | -428 | -1,0% | -3,8% |
| Reserve capital | 430 | 153 | 0,2% | 153 | 0,2% | 0 | 0,0% | 0,0% |
| Financial result of past years | 460+465 | 3 016 | 3,6% | 6 313 | 7,1% | 3 296 | 109,3% | 3,5% |
| Financial result of fiscal year | 470+475 | 3 258 | 3,9% | 3 806 | 4,3% | 548 | 16,8% | 0,4% |
| Total for Section III | 490 | 48 344 | 58,4% | 51 759 | 58,4% | 3 415 | 7,1% | 0,0% |
| Long-term liabilities | ||||||||
| Loans and credits | 510 | 13,900 | 16.8% | 13,562 | 15.3% | -338 | -2.4% | -1.5% |
| Deferred tax liabilities | 515 | 790 | 1.0% | 1,050 | 1.2% | 260 | 32.9% | 0.2% |
| Other long-term liabilities | 520 | 223 | 0.3% | 149 | 0.2% | -74 | -33.3% | -0.1% |
| Total for Section IV | 590 | 14,913 | 18.0% | 14,760 | 16.6% | -153 | -1.0% | -1.4% |
| Short-term liabilities | ||||||||
| Loans and credits | 610 | 246 | 0,3% | 1 172 | 1,3% | 925 | 375,5% | 1,0% |
| Accounts payable | 620 | 19 133 | 23,1% | 20 836 | 23,5% | 1 703 | 8,9% | 0,4% |
| Deffered income | 640 | 146 | 0,2% | 137 | 0,2% | -9 | -6,1% | 0,0% |
| Reserves of future expenses | 650 | 0,52 | 0,0% | 35,30 | 0,0% | 34,78 | 6685,5% | 0,0% |
| Total for Section V | 690 | 19 527 | 23,6% | 22 181 | 25,0% | 2 654 | 13,6% | 1,4% |
| Balance (sum of lines 490+590+690) | 700 | 82 784 | 100,0% | 88 700 | 100,0% | 5 916 | 7,1% | 0,0% |
Net assets
RUR mln
| Indicator | 31.12.2008 | 31.12.2009 | 31.12.2010 | Growth, % |
|---|---|---|---|---|
| Net assets, RUR mln | 45 314 | 48 491 | 51 897 | 7,0% |
| Total assets, RUR mln | 76 688 | 82 784 | 88 700 | 7,1% |
| Authorized capital, RUR mln | 1 019 | 1 019 | 1 019 | 0,0% |
The growth of net assets in the reporting period by RUR 3,406 mln in comparison with the balance sheet data as of 31.12.2009 is mainly caused by reception of net profit by JSC "Lenenergo" following the results of the fiscal year. Essential (in 51 times) excess of net assets over authorized capital completely meets the requirements of normative acts19 to the size of net assets of the organization, and it can be regarded as a major factor of stability of the financial position of the Company under modern conditions and in the future.
Non-current assets
As of 31.12.2010, non-current assets amounted to RUR 77,398 mln, which exceeded the level of 2009 by RUR 10,951 mln. The share of non-current assets in the structure of the Company’s assets was equal to 87.3%, thus fixed assets amounted to 69.5% of total assets, or RUR 61,616 mln.
In comparison with 2009, the cost of fixed assets increased by RUR 8,499 mln. The increase was associated with the commissioning of fixed assets in the course of implementation of the investment program of the Company, and the greatest growth occurred thanks to commissioning fixed production assets.
Furthermore, in 2010 a number of substations were commissioned – among them 110/10 kV substation "Cement" (capacity of 126 MVA) in Slantsy; 35/10 kV substation "TsRP" No.40; 110 kV substation No.539; 110/35/10 kV substation "Tikhvin-city" No.143; 110 kV substation "Parnas-Communal" No.89; 110 kV substation "Neva DSK" No.145.
The sum of assets in construction in progress on the end of 2010 reached RUR 14,484 mln, or 18.7% of non-current assets. Growth of investments in construction in progress (by RUR 2,001 mln, or 16.0%) was caused by expansion of the investment program of JSC "Lenenergo" in 2010. Accomplishment of the investment program of the Company allows raising the reliability of electric power supply of consumers.
Long-term financial investments as of 31.12.2010 constituted RUR 946 mln, thus the share of the given line in non-current assets reached 1.2%. As a part of long-term financial investments the cost of shares of JSC "Northwest power management company", JSC "Lenenergospetsremont", JSC "Kurortenergo", JSC "Tsarskoselskaya Power Company", and some other companies is considered.
Relative to the beginnings of the year, the sum of long-term financial investments of JSC "Lenenergo" increased by RUR 367 mln at the expense of a:
- Decrease in their size by RUR 522 mln as a result of sales of shares of JSC "FGC UES" and JSC "Petersburg sales company" in the 1st half of 2010 according to decisions of the Boards of
Directors (Minutes No.10 as of 03.12.2009; No.20 as of 25.05.2010)20;
- Growth of the sum of long-term financial investments in the 3rd quarter of 2010 by RUR 889.5 mln in connection with the purchase of shares of JSC "Tsarskoselskaya Power Company" ("TsPC") and JSC "Kurortenergo" by offset of the counter homogeneous requirements between JSC "Lenenergo" and JSC "Lenenergospetsremont" ("LESR") under purchase and sale contracts of shares of both JSC "TsPC" and JSC "Kurortenergo" and under the loan contract with JSC "LESR" (the decision of the Board of Directors on purchase of shares from July 30, 2010 (Minutes No. 3).
Purchase in 2010 by JSC "Lenenergo" of shares of JSC "TsPC" and JSC "Kurortenergo" was the continuation of implementation by the Company of a policy of creation of a uniform power network company on the territory of St. Petersburg. The main objective of consolidation of power network assets is carrying out of a uniform technical policy in distribution networks, including creation of the uniform centre of operatively dispatching management by networks, and creation of the uniform centre of responsibility for realization of technological connections. In general, creation of a uniform network company raises the controllability of networks and the reliability of the electric power supply. Consolidation of the program of perspective development of electric networks will essentially raise further stability of the power supply system of St. Petersburg.
Revaluation and other adjustments of the cost of financial investments in 2010 were not produced.
Current assets
As of the end of 2010, current assets of the Company constituted RUR 11,303 mln, or 12.7% of balance currency, and decreased by RUR 5,034 mln (or 30.8%) relative to 2009.
The main share in the structure of current assets was taken by accounts receivable – 85.0%, or RUR 9,610 mln. In the structure of current assets there are also included inventories (9.8%, or RUR 1,108 mln), VAT on purchased values (2.3%, or RUR 256 mln), monetary funds (2.9%, or RUR 329 mln). For the reporting date, short-term financial investments of the Company were absent.
The decrease in current assets following the results of 2010 was caused by a reduction in all components (inventories, VAT, receivables, short-term financial investments, monetary funds). Thus, the most essential decrease in absolute terms takes place on the sum of receivables and monetary funds.
The total accounts receivable at the end of the fiscal year constituted RUR 9,610 mln, which is RUR 2,453 mln (20.3%) less than in the balance sheet as of 31.12.2009.
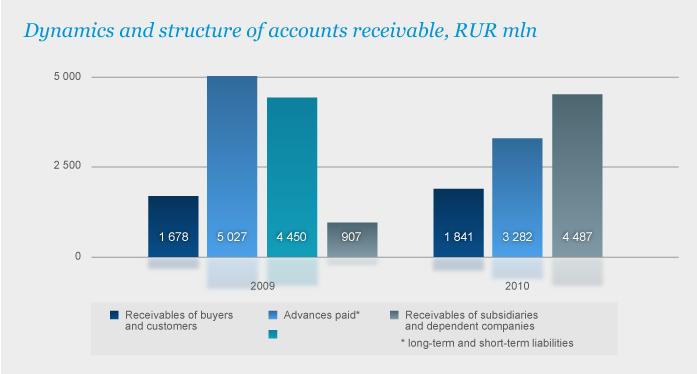
"Advances paid" make up a considerable sum in the structure of accounts receivable. As of 31.12.2010, their size reached 34.1% of the total accounts receivable of the Company. Advances paid to building organizations have the greatest weight (RUR 2,029 mln, which constitutes 21.1% of receivables and 61.8% of paid advances). It is generally associated with implementation of the investment program of JSC "Lenenergo". The advances paid under lease contracts in the amount of RUR 1,018 mln, had 31.0% of the total sum of paid advances (considered in the long-term receivables).
Buyers and Customers receivables are equal to 19.2% of the receivables. The receivables comprise: debts under agreements of electric power transmission through JSC "Lenenergo" power networks; buyers and customers debts for technological connection, etc. The growth of indebtedness following the results of the year is caused by increase in volumes of rendered services.
Other receivables are equal to 46.7% of the aggregate receivables of the Company and comprise receivables of other debtors in the amount of RUR 4,487 million, including leasing receivables equal to RUR 1,015 million, VAT on advance payments (RUR 2,708 mln), tax overpayments (RUR 429 mln), and other indebtedness.
One of the major factors which caused the considerable reduction of receivables following the results of 2010 is carrying out by the Company of work on a decrease in their level, namely, control strengthening over the advances given out that, in general, made it possible to lower the sum of the paid advances concerning the last fiscal year. Thus, the most essential decrease in an absolute expression takes place on the sum of the advances which were paid to constructing organizations (by RUR 1,535 mln).
Furthermore, in connection with the term approach in the reporting year, the indebtedness of affiliated and dependent companies, namely, the sum of the loan given to the affiliated Company of JSC "Lenenergo" - JSC "Lenenergospetsremont" at the rate of RUR 907 mln (including on RUR 889 mln by shares of JSC "Tsarskoselskaya Power Company" and JSC "Kurortenergo" – on RUR 18 mln by money resources) was extinguished.
The cash balance decreased from the beginning of the year by RUR 2,154 mln, cash were used for financing of the Company activities.
Capital and reserves
The share of own sources has the greatest value among sources of forming of property of the Company and constitutes 58.4% from balance currency, or RUR 51,759 mln. Additional capital has the main share among own sources and constitutes 78.2% from their total sum, while authorized capital constitutes 2.0%.
The size of reserve capital of JSC "Lenenergo" constitutes 15% of authorized capital. Changes in the amount of reserve capital in 2010 are absent.
In general, growth of the sum of capital and reserves following the results of 2010 by RUR 3,415 mln (by 7.1%) is mainly caused by reception of net profit by JSC "Lenenergo" following the results of the fiscal year.
Liabilities
JSC "Lenenergo" liabilities (sections 4 and 5 of the balance sheet minus deferred tax liabilities, incomes of future periods and reserves of forthcoming expenses) as of 31.12.2010 constituted RUR 35,718 mln, including:
- Long-term accounts payable – RUR 149 mln, or 0.4% of the total sum of liabilities of the Company;
- Long-term credits and loans – RUR 13,562 mln (38.0%);
- Short-term credits and loans – RUR 1,172 mln (3.3%), including indebtedness on accrued, but not paid interest at the rate of RUR 172 mln;
- Other short-term liabilities (minus incomes of future periods and reserves of forthcoming expenses) constitute RUR 20,836 mln (58.3%).
Short-term liabilities act as the second important source of forming property of the Company and constitute 25% of balance currency (RUR 22,181 mln).
The share of long-term liabilities following the results of 2010 is 16.6% of the currency of balance (RUR 14,760 mln). Long-term liabilities are formed at 91.9% at the expense of long-term credits and loans at the rate of RUR 13,562 mln.
Long-term loans and credits as of 31.12.2010 comprise liabilities under bonded loans of 02 and 03 series, placed in February and April, 2007 (RUR 6 bln) with a repayment term in 2012, as well as liabilities under long-term credits at the rate of RUR 7 562 mln, borrowed in 2010.
In the reporting year, JSC "Lenenergo" borrowed and repaid its short-term credits for a sum of RUR 2,328 mln. The borrowing of long-term credits at a rate of RUR 8,562 mln was performed. The repayment of long-term credits was performed for the sum of RUR 7,900 mln, including the syndicated credit of Barclays Bank PLC at a rate of RUR 4,900 mln. As a result, the indicator of payments covering servicing of the debts, which reflects the capability of the Company to pay its liabilities at the expense of profit and funds equal to it, following the results of 2010 decreased to 68.7%, which is 4 times below the level of the last fiscal year (by 204.1 percentage points), basically due to repayment of credits in 2010 at a volume exceeding that of the last fiscal year.
Accounts payable possess the major share in the structure of short-term liabilities, which constitutes 93.9% of short-term liabilities and 23.5% of all sources.
In the line "Short-term credits and loans" as of 31.12.2010 (5.3% of all sources) there are reflected the sums of accrued, but not paid interest credits and loans (RUR 172 mln), and the sum of the borrowed credit in 2009 at a rate of RUR 1,000 mln transferred according to the accounting requirements into the structure of short-term liabilities due to the forthcoming repayment in 2011.
In comparison with 31.12.2009, the sum of short-term accounts payable increased by RUR 1,703 mln, or 0.2% in relative terms – mainly at the expense of growth in liabilities on advances received (by RUR 1, 783 mln, or 11.6%).
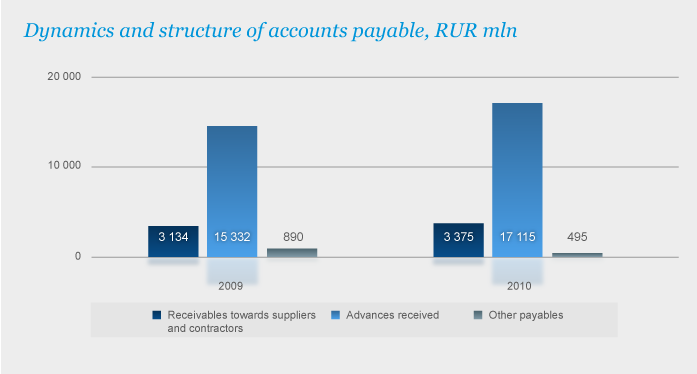
Advances received prevail in the structure of total (long-term and short-term) accounts payable (81.6%) and are almost completely formed at the expense of advances on technological connection.
This is associated with the repayment terms of counterparts for the services on connection to electric networks of JSC "Lenenergo" (payment of the given services is produced via complete or partial advancing). As of 31.12.2010, the sum of advances received under contracts for services on technological connection increased in comparison with the end of the previous year, and reached RUR 17,108 mln.
Accounts payable towards suppliers and contractors in the total sum of accounts payable constitute 16.1%, and are generally represented by current liabilities towards network and building organizations.
The share of other payables constitutes only 2.4% (including current wage liabilities towards personnel in the sum of RUR 119 mln (0.6%), tax liabilities in the sum of RUR 121 mln (0.6 %), liabilities towards state off-budget funds in the sum of RUR 43 mln (0.2%), and liabilities towards other creditors in the sum of RUR 211 mln (1.0%).
Following the results of 2010 there was a change in the structure of liabilities of the Company – the growth of the share in the most urgent liabilities, under a simultaneous decrease in the share of long-term liabilities. This is associated with a multidirectional change of long-term (insignificant decrease) and short-term liabilities (growth at the expense of an increase in accounts payable and short-term liabilities under credits and loans – due to the transfer into its structure of liabilities under long-term credit in a sum of RUR 1 bln before the repayment date, for which there remain less than 12 months).
As a result, there was an insignificant deterioration in the structure of the borrowed sources of forming of property of JSC "Lenenergo". This is caused by the fact that creditors may claim the sources of borrowed funds in the form of accounts payable urgently; therefore, they are not reliable enough. While long-term sources of forming of property, including long-term credits and loans, are more preferable from the position of provision of financial stability of the Company.
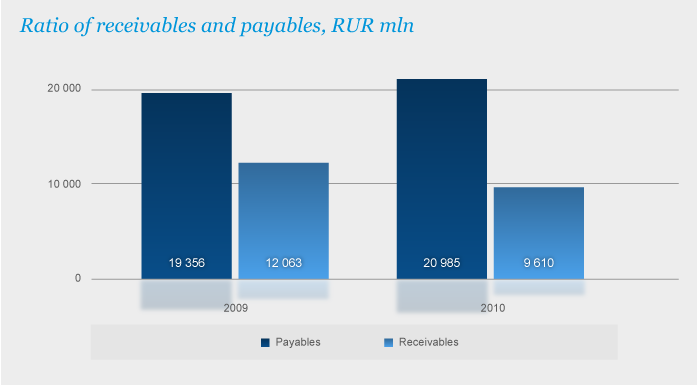
Ratio of receivables and payables
RUR mln
| Indicator | 2008
| 2009
| 2010
| Growth 2010/2009 |
|---|---|---|---|---|
| Payables | 19 351 | 19 356 | 20 985 | 8,41% |
| Receivables | 12 968 | 12 063 | 9 610 | -20,3% |
| +/- | - 6 383 | - 7 293 | - 11 375 | 56,0% |
| Payables/Receivables ratio | 0,67 | 0,62 | 0,46 | -26,5% |
Payables/receivables ratio reflects the degree of crediting by the Company of buyers, and of itself – by sellers, and it is considered normal at the level of 1.2-1.5.
In terms of multidirectional changes in the sums of accounts receivable (decrease) and accounts payable (growth) following the results of 2010, there occurred some decrease in the indicator reflecting their ratio.
In the course of analysis of payables/receivables ratio, including in a dynamic aspect, features of financial and economic activity of JSC "Lenenergo" associated with accomplishment of the investment program and fees on technological connection should be considered.
Indicators of the Profit and Loss Statement
Following the results of financial and economic activity of JSC "Lenenergo" in 2010 the following financial results were reached:
RUR mln
| Indicator | Line code | 2008
| 2009
| 2010
| Growth 2010/2009 |
|---|---|---|---|---|---|
| Revenue (net) | 010 | 20 828 | 26 088 | 34 201 | 31,1% |
| Cost of goods sold (COGS) | 020 | -17 680 | -20 815 | -27 488 | 32,1% |
| Profit (loss) from sale | 050 | 3 148 | 5 273 | 6 713 | 27,3% |
| Interest receivable | 060 | 378 | 35 | 63 | 79,9% |
| Interest payable | 070 | -722 | -773 | -938 | 21,3% |
| Profit from participation in other organizations | 080 | 26 | 16 | 25 | 56,1% |
| Miscellaneous incomes | 090 | 427 | 1 930 | 1 496 | -22,5% |
| Miscellaneous expenses | 100 | -973 | -2 395 | -2 076 | -13,3% |
| Profit (loss) before taxation | 140 | 2 284 | 4 086 | 5 282 | 29,3% |
| Deferred tax assets | 141 | 37 | 16 | 43 | 161,7% |
| Deferred tax liabilities | 142 | -92 | -80 | -260 | 224,7% |
| Profit tax | 150 | -690 | -764 | -1 260 | 64,8% |
| Other similar payments |
| 0 | 0 | 0 | - |
| Total profit tax and other payments |
| -745 | -828 | -1 477 | 78,4% |
| Net profit (loss) of the reporting period | 190 | 1 540 | 3 258 | 3 806 | 16,8% |
Revenue
JSC "Lenenergo" revenue in 2010 constituted RUR 34,201 mln (the growth of 31.1% to the level of 2009).
RUR mln
| Revenue | 2009 | Share in revenue | 2010 | Share in revenue |
|---|---|---|---|---|
| Revenue, total, including: | 26 088 | 100,0% | 34 201 | 100,0% |
| From electric power transmission on networks | 19 597 | 75,1% | 23 873 | 69,8% |
| From technological connection | 6 326 | 24,2% | 10 164 | 29,7% |
| Other services | 165 | 0,6% | 164 | 0,5% |
Receipts of revenue from primary activity for 2010 were formed in the following directions:
- revenue from electric power transmission following the results of 2010 constituted RUR 23,873 mln (69.8 % of total revenue);
- revenue from technological connection reached RUR 10,164 mln (29.7% of total revenue);
- revenue from rendering of other services constituted RUR 164 mln (0.5%).
Other activities of JSC "Lenenergo" comprise work and services of industrial character rendered to legal entities and individuals under the contracts concluded in the interests of JSC "Lenenergo", on the condition of timely and qualitative execution of works on primary activity. The list of services and their cost is determined by the Price list, which is annually approved by Director General.
The decrease in revenue on other services in 2010 in comparison with 2009 occurred due to the transfer of non-core assets to municipalities in 2009.
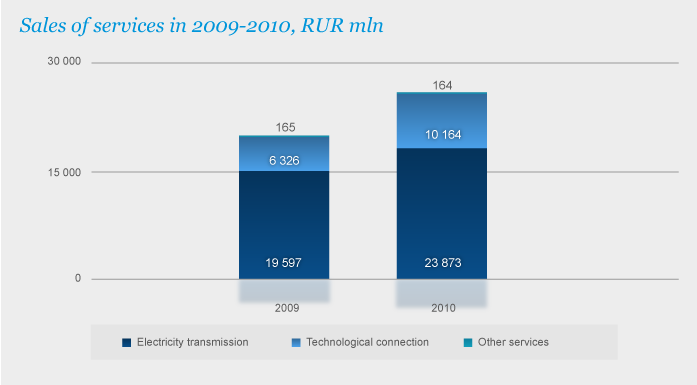
Growth in sales revenue following the results of 2010 was accompanied by growth in its components (revenue from electric power transmission, from technological connection).
Cost of goods sold (COGS)
Cost of goods sold of JSC "Lenenergo" in 2010 constituted RUR 27,488 mln (+32.1% to the level of 2009).
RUR mln
| COGS, total | 2009 | Share in total sum | 2010 | Share in total sum |
|---|---|---|---|---|
| Network services, including: | 20 670 | 99,3% | 27 417 | 99,7% |
| Electric power transmission | 19 301 | 92,7% | 26 112 | 95,0% |
| Technological connection | 1 369 | 6,6% | 1 305 | 4,7% |
| Other services | 145 | 0,7% | 71 | 0,3% |
| Total | 20 815 | 100,0% | 27 488 | 100,0% |
The structure and dynamics of total cost of goods sold of JSC "Lenenergo" for 2009 and 2010 is presented in the table and charts:
RUR mln
| COGS, total | 2009 | Share in total sum | 2010 | Share in total sum |
|---|---|---|---|---|
| Material costs | 4 334 | 20,8% | 6 300 | 22,9% |
| Works and services of production character | 8 468 | 40,7% | 11 313 | 41,2% |
| Salaries and social charges | 2 374 | 11,4% | 2 643 | 9,6% |
| Depreciation | 3 330 | 16,0% | 4 135 | 15,0% |
| Other costs | 2 309 | 11,1% | 3 098 | 11,3% |
| Total | 20 815 | 100,0% | 27 488 | 100,0% |

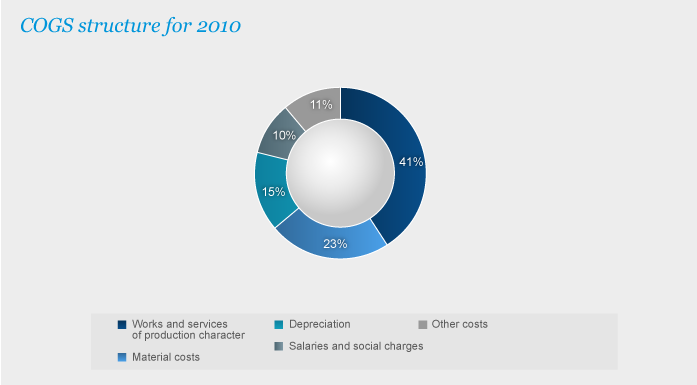
Following the results of 2010, the most essential changes in the structure of COGS occurred concerning the growth in material costs share and the decrease in the share of wage payments (with social deductions).
Thus, in absolute terms the most considerable growth (by 33.6%, or RUR 2,844 mln) was noted under the line "Works and services of production character" at the expense of growth of costs for services of network companies on electric power transmission – tariffs for these services are established by regulatory bodies. The growth in the size of depreciation charges (by 24.2%, or RUR 804 mln) occurred at the expense of growth in fixed assets - at the expense of commissioning of fixed assets as a result of execution of the investment program.
The increase in sales profit is associated with more considerable growth in revenue of the Company over the COGS increase in absolute terms.
Miscellaneous incomes and expenses
Interest payments of JSC "Lenenergo" in 2010 increased by RUR 165 mln relative to 2009, and amounted to RUR 938 mln in the reporting year. Interests were calculated under credits and loans borrowed in 2007 (bonded loan of 02 and 03 series, syndicated credit), and under new credits borrowed by the Company in 2009-2010. The growth of interest payments was generally caused by the increase in the sum of the basic debt on which the interest charge in the reporting year was performed.
In 2010, there was an increase (1.8 times) in interest payments for the benefit of JSC "Lenenergo", which reached RUR 63 mln. The specified incomes depended on cash balances on settlement accounts of the Company within the year.
Incomes of the Company from participation in other organizations increased by 56.1% in comparison with the similar indicator of 2009, and constituted RUR 25 mln. Dividends in 2010 were received under shares belonging to JSC "Lenenergo" from JSC "Petersburg Sales Company", JSC "Northwest Power Management Company", and JSC "Energouchet".
The decrease in comparison with the last fiscal year of absolute values of indicators of miscellaneous incomes (by RUR 434 mln) and expenses (by RUR 318 mln) is appreciably caused by the decrease in the volumes of calculations by bills with suppliers and contractors in 2010.
Thus, in general relative to 2009, there was an increase in the negative balance of miscellaneous incomes and expenses (excluding interest receivable and payable, and incomes on participation in other organizations) by RUR 115 mln (24.7%).
Profit before taxation, profit tax
The increase in sales profit in 2010 relative to 2009 exceeded the growth of negative balance of miscellaneous incomes and expenses (excluding interest and incomes on participation in other organizations). As a result, profit before taxation increased by RUR 1,196 mln.
Profit tax and other similar obligatory payments following the results of 2010 reached RUR 1,477 mln. The sum of the current profit tax constituted RUR 1,270 mln.
RUR mln
| Period | Total profit | Balance of miscellaneous incomes and expenses | Profit before taxation | Profit tax and other similar payments | Net profit |
|---|---|---|---|---|---|
| 1 | 2 | 3 | 4=2+3 | 5 | 6=4+5 |
| 2009
| 5 273 | -1 187 | 4 086 | -828 | 3 258 |
| 2010 | 6 713 | -1 430 | 5 282 | -1 477 | 3 806 |
| Change | 1 440 | -243 | 1 196 | -649 | 548 |
Net profit
The net profit of JSC "Lenenergo" following the results of 2010 increased by RUR 548 mln and reached RUR 3,806 mln.
RUR mln
| Indicator | 2008
| 2009
| 2010
| Growth |
|---|---|---|---|---|
| Sales profit (loss) | 3 148 | 5 273 | 6 713 | 27,3% |
| Profit (loss) before taxation | 2 284 | 4 086 | 5 282 | 29,3% |
| Net profit | 1 540 | 3 258 | 3 806 | 16,8% |
Since 2008, the indicators of sales profit, profit before taxation, and net profit have demonstrated a growth tendency that promotes provision of stability of the financial condition of the Company.
The increase in net profit following the results of 2010 was caused by the growth in revenue of the Company relative to the previous reporting period.
19 Item 35 of the Federal Law “On joint stock companies” as of 26.12.1995 No.208-FZ.
20 The decision on sale in quarter 1, 2010 of shares of JSC “FGC UES”, belonging to the Company (583,195,165 pieces of ordinary shares) was approved by the Board of Directors (Minutes No.10 as of 03.12.2009.). The decision on the termination of participation of JSC "Lenenergo" in JSC “Petersburg sales company” by sale of shares of JSC "PSC" it was approved by JSC "Lenenergo" Board of Directors (Minutes No.20 as of 25.05.2010). Sales of shares of JSC "PSC" was actually performed in quarter 2, 2010.
Top

